








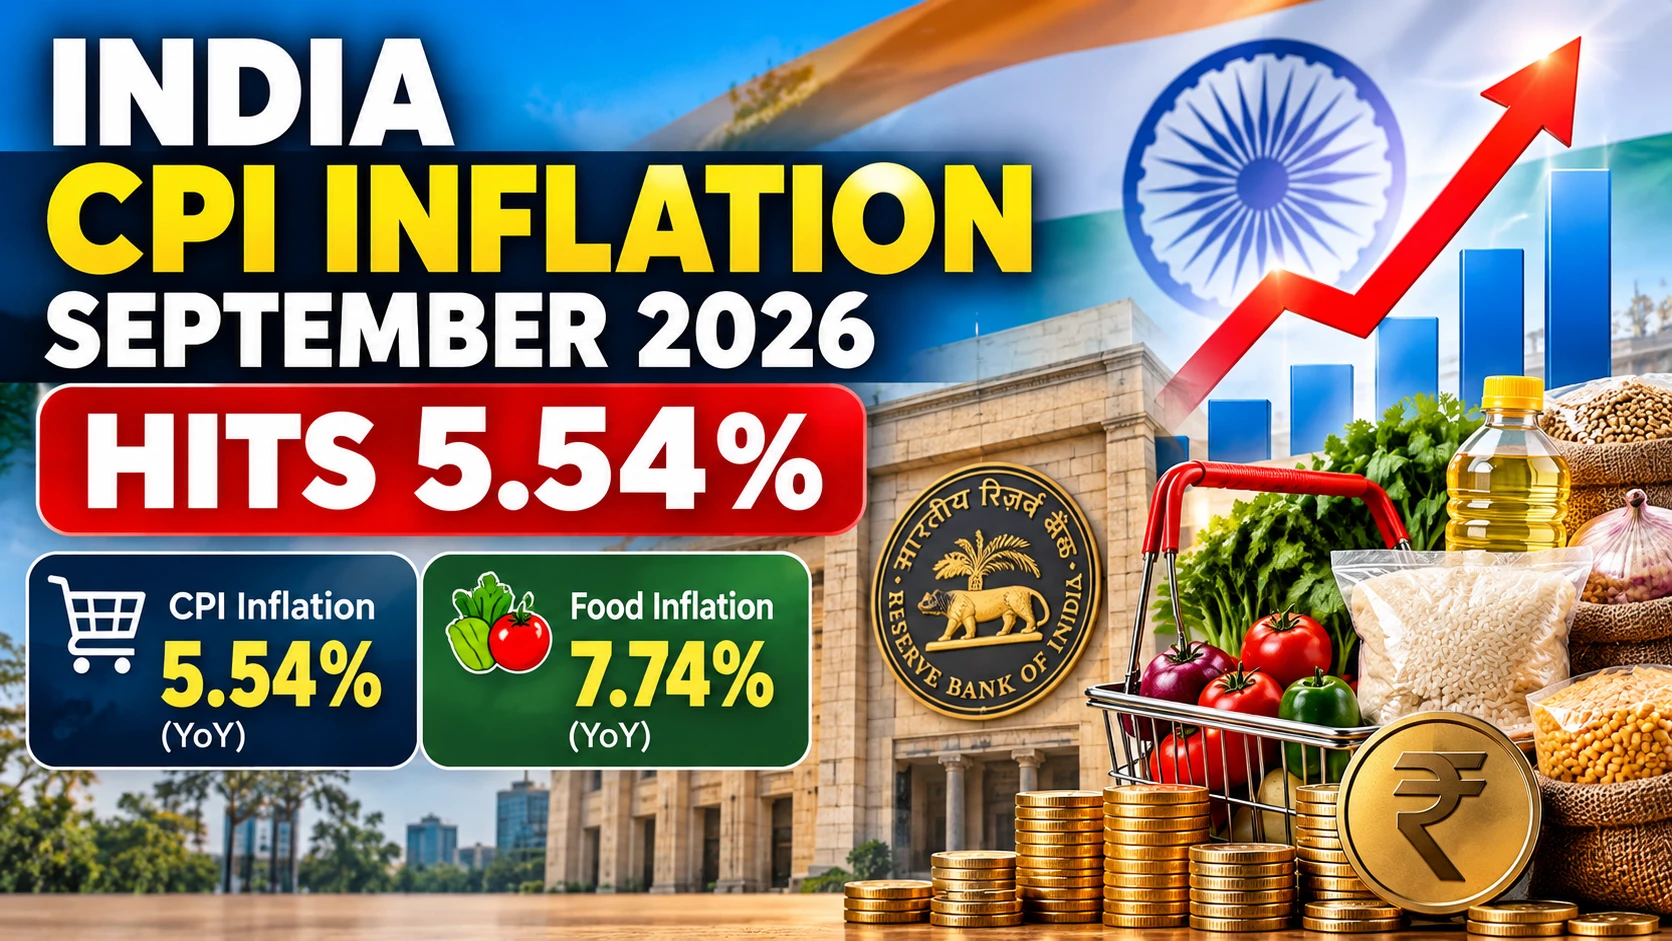
New Delhi, October 13, 2026: India’s retail inflation accelerated to 5.54% in September 2026 from a final 4.83% in August, according to the Ministry of Statistics and Programme Implementation (MoSPI) release published on October 12. Consumer Food Price Index inflation reached 7.74%. September figures are provisional and use the CPI series with base year 2024=100.
Key Takeaways
- September headline CPI inflation was 5.54%, against August’s final 4.83%.
- Food inflation reached 7.74%, compared with 5.97% in August.
- Rural CPI inflation was 6.08%; urban inflation was 4.88%.
- Onion inflation reached 108.09% year on year.
- The next CPI release is scheduled for November 12, 2026.
What the October 12 Government Release Confirms
MoSPI’s Consumer Price Index release gives a measure of how a representative basket of goods and services changed in price over the previous year. The 5.54% figure is an all-India combined rate, not the rate experienced by every household. The release labels September provisional and August final. That distinction matters when comparing months: previously published August estimates may differ slightly from the finalized 4.83%. Readers should use the October 12 release for the comparison and avoid mixing figures from different revisions or index series. The release also provides separate rural and urban tables, division-wise rates, and state data.
CPI and Food Inflation: August Versus September
Headline CPI moved up by 0.71 percentage points, from 4.83% to 5.54%. The Consumer Food Price Index rose by 1.77 percentage points, from 5.97% to 7.74%. These are changes in annual inflation rates, not direct changes in the rupee price of a specific basket between August and September. Food and beverages as a broader CPI division showed 7.36% inflation, while the narrower CFPI food index recorded 7.74%. The two figures refer to different baskets and should not be treated as a data inconsistency. Both measures point to meaningful pressure on household food spending.
Why Food Prices Dominate the Story
MoSPI’s item-level data shows sharp increases in certain everyday ingredients. Onion inflation reached 108.09% year on year, ginger 62.85%, garlic 54.62% and lemon 36.41%. Those figures measure national item indices, not a single shop’s selling price. Different supply conditions, local transport costs, seasonal arrivals and retail margins mean that actual prices can vary significantly between cities and villages. The statistical release documents price movements but does not establish a single cause for every increase. Any explanation based on weather or production should be supported by separate agricultural data rather than presented as a finding of the CPI report.
Not Every Item Became More Expensive
Inflation is not uniform. The September release lists negative annual inflation for potatoes at minus 11.50%, tomatoes at minus 8.62%, lady’s finger at minus 4.48% and coconut at minus 3.99%. Such negative rates mean the respective measured item index was below its level a year earlier; they do not mean every retail outlet reduced prices by the same percentage. A family buying more onions and less potatoes can face a very different grocery bill from another family. This is one reason household budgets may feel tighter even when some items have become cheaper on the national index.
Read Also: Delhi CJP Protest Today: Fresh Jantar Mantar March Called for October 11
Rural Versus Urban: Why the Gap Matters
Rural headline inflation reached 6.08%, compared with 4.88% in urban areas. The corresponding food rates were 8.06% and 7.18%. The figures reflect differences in consumption weights and price movements across rural and urban markets, not necessarily higher prices for every item in every village. For households that devote a larger share of income to food, faster food inflation can leave less money for school supplies, transport, healthcare and savings. The rural headline reading sits above the upper edge of the RBI’s 2%-6% tolerance band, although monetary policy targets headline inflation overall.



How the 2024 Base-Year CPI Works
The current release uses a 2024=100 base for the CPI series. A base year provides a common reference point for tracking changes over time, while the weighting structure reflects the consumption basket used by the statistical agency. Readers should not compare an index level from the newer series mechanically with a level published under an older base. The ministry’s published year-on-year rates are the appropriate headline comparison. CPI inflation is a rate of change: 5.54% does not mean prices are 5.54% higher than last month. It means the measured combined basket is 5.54% above its September 2025 level.
Other Categories Worth Watching
Price pressure extended beyond groceries. The September release reports transport inflation of 5.01%, education services at 3.94%, restaurants and accommodation services at 9.36%, and personal care, social protection and miscellaneous goods and services at 13.75%. These categories are broad groupings rather than a forecast of what an individual consumer will pay. Higher transport and service costs can affect household purchasing decisions, but the effect depends on income, location and spending patterns. Readers planning budgets should compare their own recurring expenses over several months instead of using the headline CPI number as a universal personal inflation rate.
What This Means for RBI Interest-Rate Decisions
The Reserve Bank of India uses inflation alongside growth, financial conditions and other indicators when setting monetary policy. A higher CPI reading can increase concern about persistent price pressure, but it does not automatically produce a rate increase at the next meeting. Policy decisions depend on the Monetary Policy Committee’s assessment of the outlook, not one month’s release alone. Borrowers should avoid assuming that their EMI will change immediately because the September CPI figure rose. The impact on loan pricing depends on the benchmark, the bank’s reset schedule, the loan agreement and any subsequent policy or lending-rate change.
Practical Steps for Households and Businesses
Families can use the data as a prompt to review grocery and transport expenses rather than make rushed financial decisions. Track actual prices paid for staple items, distinguish unavoidable spending from discretionary purchases and keep emergency savings accessible. Small retailers should monitor input costs and inventory turnover without assuming that every product can sustain a uniform price rise. Businesses negotiating contracts may benefit from specifying which cost index applies to price revisions. Investors should not treat CPI alone as a signal to buy or sell stocks, gold or bonds. It is one economic indicator among many.
Next CPI Release and Official Sources
MoSPI schedules the October 2026 CPI release for November 12, or the next working day if it is a holiday. Until then, September remains the latest official monthly headline. The ministry cautions that some detailed state and item estimates may rely on thin samples. Read the October 12 MoSPI CPI release and the eSankhyiki data portal. Related EduTaxTuber coverage: Money and Market.
Editorial Disclosure and Disclaimer
Some content was prepared with AI assistance and editorial review. This report is educational, not financial, investment, tax or legal advice. Official statistics can be revised. EduTaxTuber is not responsible for losses caused by reliance on this article to the extent permitted by applicable law.